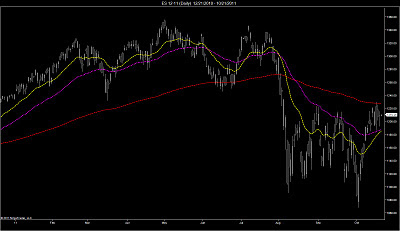
The market continues to be event driven as it awaits a resolution
over the EFSF leverage issue. In the interim the market is in a holding
pattern hovering just above support at it’s 50DEMA and just below
resistance at it’s 200DEMA (chart1). The burning question is whether
the market is consolidating above support (1190-1185) or whether the
price action is distributional as a result of the market's continued
inability to break the 1220-1230 level. A break lower would result in
the ES testing 1170 and a break higher would result in an assault of 1260.
Unfortunately, signals are mixed. Cumulative market breadth ($ADD) and
cumulative $TICK are positive, however their shorter time-frame
constituents are negative, which implies that the market is simply
overbought (chart 5). Breadth was mixed today, with a slight positive
advantage on the NYSE and a modest negative margin registered on the
NASDAQ, however the amount of new lows expanded, while the amount of
new highs contracted, offering further evidence of short-term
weakness, while the continued strength of the $VIX issued a clear signal
of present danger, as it once again, closed above it’s 50DEMA and
traded as high as 36.87 today (chart 4).
On the bullish side of the coin, market lows are usually made in the month of October, and the fourth quarter has historically been the strongest quarter for the market. Since1928, the S&P 500 has averaged a gain of 2.44% in the fourth quarter, and over the last 20 years, the index has averaged a gain of 4.57% in Q4, which is more than twice as strong as the next closest quarter. So even, if the market were to break from here, there is a high probability that it would snap right back. The yield curve is steepening once again as treasury yields rise which may be a welcome presage for the bulls, if OT’s effect on the market is similar to the effect QE1 and QE2 had in the past (chart 2). However, as with the market sell-off scenario, I would expect a near term rally to quickly exhaust itself at the aforementioned level of 1260.00.
On the bullish side of the coin, market lows are usually made in the month of October, and the fourth quarter has historically been the strongest quarter for the market. Since1928, the S&P 500 has averaged a gain of 2.44% in the fourth quarter, and over the last 20 years, the index has averaged a gain of 4.57% in Q4, which is more than twice as strong as the next closest quarter. So even, if the market were to break from here, there is a high probability that it would snap right back. The yield curve is steepening once again as treasury yields rise which may be a welcome presage for the bulls, if OT’s effect on the market is similar to the effect QE1 and QE2 had in the past (chart 2). However, as with the market sell-off scenario, I would expect a near term rally to quickly exhaust itself at the aforementioned level of 1260.00.


No comments:
Post a Comment