THE VOICE OF TRADESTRONG MANAGEMENT

Thursday, October 20, 2011

Opex Pump and Dump?


The bulls failed to follow through on yesterday’s comeback rally, as the event driven market ran out of steam at the 200DEMA, once again. As was stated yesterday ,“the market needed to accept above Friday's VAh @ 1215.25, and quickly make new highs with a close above the 200DEMA, in order to meet it's 1260.00 target, otherwise the double-top reversal scenario would take precedence going into opex,“ which is exactly the situation the market now finds itself in, with 1215.25 now becoming short-term resistance.

While the ES still closed well above it’s 50DEMA, and held the bottom trendline of it’s bull channel, the VIX closed above 34.00, and above it’s 50DEMA, along with the $ TICK daily, which closed below zero for the first time since the rally began on 10/04, casting doubt as to whether the nascent rally is capable of being sustained.The October VIX Futures settled at 33.15 this morning, down 57 cents from last month's settlement. This is the third month in a row that the futures expired with a value above 30. This hasn't occurred since the 2008 crash, proving once again that fear is a stronger emotion than greed, and that a break to 1170.00 is highly probable.

Tuesday, October 18, 2011

Bulls Blast Off!


The bears failed to follow through with what they began early Monday morning, allowing the bulls to regroup and maintain control. Once again, the market quickly discounted the negative news out of Europe, allowing the bulls to not only support the market, but to unceremoniously, launch it higher. Market rebounds needs a certain amount of strength showing up in the A-D numbers at the beginning of an uptrend, or else prices roll over and head back down to the level of the prior low, or even lower. The NYSE answered the call today, with close to a 90% day, on 9-1 positive breadth, and 26 new highs to go with the NASDAQ’s 24 new highs, on very good volume. And, in the process, may have answered the question on everybody’s mind the past few trading sessions. Are the bulls getting stronger, or were the bears just laying in weeds, waiting for the right opportunity to deliver maximum pain? While the question may have been answered resoundingly today, I must admit, the price action still casts a sliver of doubt in my mind.

The market now needs to accept above Friday's VAh @ 1215.25, and quickly make new highs, or the double-top reversal scenario will hang over the market going into opex. Nevertheless, from the attached chart, it is evident that the ES was still firmly ensconced in it’s recent upward trend channel. One of the best indicators of a change in the short term direction of the market in the recent choppy trading environment, has been the holding or breaking of an extant trend channel, as we witnessed this morning. Sometimes, it's best to keep things simple.

Just When You Thought It Was Safe To Buy Equities...

Last night’s rally on bullish follow-through momentum from Friday, ran out of buyers early Monday morning as the ES ran up against it’s 200 DEMA and RTH - R2. Once again, headlines out of Europe was the catalyst for another global equities sell-off, as the ES took it on the chin for 38 points (H-L) with the small caps (TF) and European indices (FESX,FDAX) leading the way down.

Liquidity was adaequate which resulted in an orderly trend-day-down which never reached waterfall status. No doubt weak longs were the target of the sell-off, which resulted in an only 9% day on the NYSE and a 17% day on the NASDAQ, with declining shares leading advancing shares 5-1 on both exchanges. Nevertheless, there were 30 new highs combined on the 2 exchanges, but also 29 new lows.

Market internals and price action still suggests that the bulls are in control, as the bulls continue to support the market on bad news, and rally the market on good news. Ranges have contracted, and liquidity is not being pulled as often as it had been, along with the recent improvement in market breadth and leadership.

While all the indicators are not bullish, the major indices are still above their 50EMAs and the VIX is still below its 50EMA, but they must quickly consolidate at current levels (1190.00), and assert their strength once again, (accept above 1220.00) if they are going to resume the uptrend and fulfill their upside potential.

Still, in the near and intermediate term, the market remains vulnerable to headline risk out of the Euro-zone, along with negative economic news at home. An $SPX close below 1170 and a $VIX close above 34 would consequently, alter my somewhat bullish view.

Sunday, October 16, 2011

Trading With A Twist


As a recent article in Bespoke pointed out, “It has been three weeks now since the Fed formally announced its $400 billion Operation Twist program on September 12th. If early indications are a sign of what's to come, however, this will be the third straight time the Fed has tried and failed to lower long-term interest rates through the Treasury market. “

Operation Twist involves selling short-term Treasuries in exchange for the same amount of longer term bonds. The policy’s intent is lower yields on long term bonds, while keeping short term rates little changed, in essence, to flatten the yield curve. A failed policy in 1961, I seriously doubt that Bernanke himself, thought that increasing the average maturity or “twisting” the Fed’s portfolio, would have any effect on the economy or rates. In reality, it was more of a PR move designed to reiterate the central bank’s policy objectives, and maintain credibility with the investing public.

While the Fed’s policy attempts have fallen short at bringing down rates and invigorating the economy, there is no denying the impact they have had on the broader market. Once again, the SPX appears to have put in a swing bottom that is highly correlated with the Fed’s actions, and once again rates are rising concomitantly. (Chart 1)

Whether intended or not, the Fed’s machinations have an effect on the markets, that can present observant traders with relevant opportunities that have a high probability of success. Operation Twist, of course, involves the simultaneous sale and purchase of both short and long-term securities, so it’s impact will be the greatest on the Treasuries’ yield curve.

Investopedia defines the yield curve as, A line that plots the interest rates, at a set point in time, of bonds having equal credit quality, but differing maturity dates. The most frequently reported yield curve compares the three-month, two-year, five-year and 30-year U.S. Treasury debt. This yield curve is used as a benchmark for other debt in the market, such as mortgage rates or bank lending rates. The curve is also used to predict changes in economic output and growth.
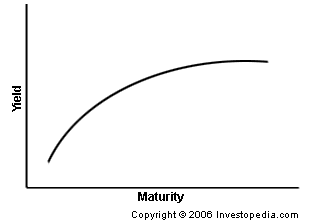


In futures terms , it is the spread between the yields of the same security with differing maturities, and the NOB spread is one of the most heavily traded yield curve spreads. If you expect the yield curve to to steepen, you typically want to buy the spread. If you expect the yield curve to flatten, you will want to sell the spread.

If a trader expects the yield curve to steepen, he can buy the 10 year note and sell the 30 year bond( buy the NOB). When the yield curve steepens, the 10 year Treasury cash yield will fall relative to the 30-year Treasury cash yield, and the10-Year Note futures price will rise relative to the 30-Year bond’s futures price.That is, a long position in the 10-Year Note futures will gain more than a short position in 30-Year bond futures will lose. Due to the inverse nature between price and yield in Treasuries, the yield spread will increase, but the price spread will decrease as with any bull spread.The converse is true, for a trader that is expecting the curve to flatten.

True yield curve spread filters out directional effects (i.e., changes due to parallel shifts in the yield curve) and responds only to changes in the slope of the yield curve (i.e., non-parallel shifts).The goal is to filter out directional effects and design a spread trade that will respond only to changes in the shape of the yield curve. In order to do so, NOBS are usually traded as ratio spreads, with the current ratio being 5:2, notes over bonds. This ratio matches the dollar value of a 1-bp change (DV01) in the yield of the shorter-term maturity futures position and that of the longer-term maturity futures position. A DV01 indicates approximately what one futures contract will gain or lose in dollars for every 1-bp change in yield.

It is best to trade the NOB in the direction of the prevailing trend, by buying weakness at or near support or selling strength at or near resistance, however a mean reversion strategy can be utilized in a range market. A daily chart can be used to identify the prevailing trend, and a 15 minute chart is good for execution. Since the end of July/ beginning of August, the yield curve had been flattening, so selling the NOB on rallies, was the best strategy. However, in an ironic twist of fate, yields on treasuries have rallied, and so has the yield curve, since Operation Twist was implemented on Sept. 21. Until a bottom in yield and a change in the curve is confirmed, I would consider the curve trade a trading affair. (Chart 3)

Unfortunately, if you use NinjaTrader, their platform is not conducive to spread trading, so if you want to put on a spread, you have to leg it. You will also be unable to place a stop using the spread price, so it must be done dynamically. Other platforms, i.e., TT and Cunningham, cater more to spread traders. I like the “pairs suite” indicator, along with a few others that can be found on BMT or NT, that work just as well. In addition, I overlay the PRC2 indicator on the “pairs ratio” indicator, which provides me with support/resistance and a visual of the near -term trend, and use the RSI of the spread for confirmation. I trade the spread with a 2:1 ratio, instead of the recommended 5:2, just for simplicity’s sake, but one can experiment with different ratios to achieve different deltas.

“A yield curve spread trade is a speculative trade, but it shifts the burdenof speculation from taking a position on interest rate or price direction to taking a position on what you expect the yield curve to do. This gives you an extra way to be right, for you have no concern for rate or price direction, only for yield curve steepening or flattening.” CME Group

Saturday, October 15, 2011

Bullish Breadth


While the war is certainly far from over, the bulls won the battle today, staging a late afternoon rally, after what had been a day of distributional action and indecisiveness. Retail sales rose in September by the most in seven months, however, consumer confidence cast doubt as to whether gains in spending could be sustained, as shoppers’ confidence waned. The market rallied briefly after the news, making new highs, but a short term overbought market, was unable to overcome the sell-the-new-high algorithms.The market then traded in a narrow range, under the session VWAP, unable to get above it’s opening range for most of the day. However, the market languished in a territory that was well above the previous day’s value and never below the RTH session R1, as capital flowed into risk assets and out of treasuries and the dollar.

While market breadth continued to swing wildly back and forth with the market’s volatile movements, the past few sessions has seen breadth expand to the point where breadth indicators began to elicit buy signals. According to Bespoke,“77% of S&P 500 stocks are now above their 50-day moving averages, which is the highest level seen since the April highs. Bulls have been waiting for a nice expansion in underlying breadth for confirmation of a rally, and now they seem to have it.” Today’s internals confirmed, as the NYSE put in an 83% day, with advancing shares leading the way, by almost 5-1. New highs blew away new lows on the NYSE and NASDAQ, 49-15 as techs took charge, once again. For the week, the Dow Jones Industrial Average rose 541 points, or +4.9%. The S&P 500 Index gained 69 points, or +6.0%, its best week since July 2009. The Nasdaq was up 188 points, or +7.6%.

Volatility continued to be drained, as the $VIX finally broke below it’s support @ 30.00, signalling that it is now safe for any reluctant bulls, to buy. According to Rennie Yang, the $VIX has fallen 7 straight days, 37 times since 1990, and 91% of the time, the SPX was higher 2 months later. The ES has now retraced 50% of it’s move from it’s 52 week high-low, yet unlike the NQ, it has yet to trade above it’s 200DEMA at 1232.00. And while those in the bulls' camp would prefer to see a more decisive "confirmation day", with market acceptance above the 200MA as a sign of renewed institutional demand, the bulls appear to have the upper hand, holding the door open for a move to 1260.00 - which certainly suggests that a modestly bullish discretionary bias is warranted in the short term.

Wednesday, October 12, 2011


ESZ 135min
Although the ES closed up 1% today, on day 7 of the rally off the last Tuesday’s swing low, the market was wacked for 20 handles in the last hour of trade, as it approached it’s 200 DEMA, and the 6E tested it’s 50DEMA. Ironically, the market had been enjoying a very strong day, and still put up very good numbers on the day, with the NYSE enjoying close to a 90% day, on good breadth( 9-1), and new highs outpacing new lows 17-2. The NASDAQ experienced a 72% day, with advancing shares leading declining shares by 4-1, and new highs exceeding new lows 21-14.

Waning momentum finally caught up with the ES, as it came within 5 points of reaching the 1220 level which was previously identified as being an upside target, and an area of resistance. Although the market’s rally is still intact and not technically damaged, the inability of the market to stage a true follow-through-day, should quickly attract shorts. Support now looms below at 1180 and 1150. A break below 1150 would no doubt embolden the bears for a run at taking out last Tuesday’s low.

Tuesday, October 11, 2011

Crunch Time
While both the ES and the $VIX closed unched for the day, the bulls managed to keep the trade above the VWAP for the majority of the day. This was the 6th trading day since the swing low was made last Tuesday, and the first day the market didn't close higher. It was also notable for the lack of volume, which was lower than yesterday's, which was a bank holiday.

Nevertheless, The ES closed above it's 50EMA for the second consecutive day, and the $VIX , closed below it's 50EMA for 2nd straight day, also. Breadth was slightingly bullish, and as could be expected, it was an approximately 50% day on both exchanges. Of note, however, was the fact that new highs finally led new lows on the NYSE, as new lows led new highs on the NASDAQ. In total on both exchanges, new highs led new lows, 40-25.

Of greatest concern for the bulls, is the anemic volume, although some leadership appeared today, with the slight expansion in the number of stocks making new highs. A convincing FTD would confirm a continued rally, however it is most ideal for a FTD to come between day 4-7 of a new rally attempt - so time is running out.

Certainly, all the shorts who wanted to cover, have had their chance, so it is doubtful, whether there are any weak shorts left, that could continue to fuel the rally. Buying, in the form of new longs, is needed for a sustainable second leg of the rally.

Instead it is beginning to look a lot like price exhaustion. As TD said the other day, tops and bottoms are not made by selling and buying, but by an absence of buying and selling. The lack of volume the past 2 days is indicative of buying drying up, and a swing top.

Once again, the market is at a level, where it has rallied dramatically to before, and failed, just as dramatically. It appears that tomorrow (Day7), may be "crunch time" for the bulls, where a failure to rally on big volume, with emerging leadership, will spell the end.